

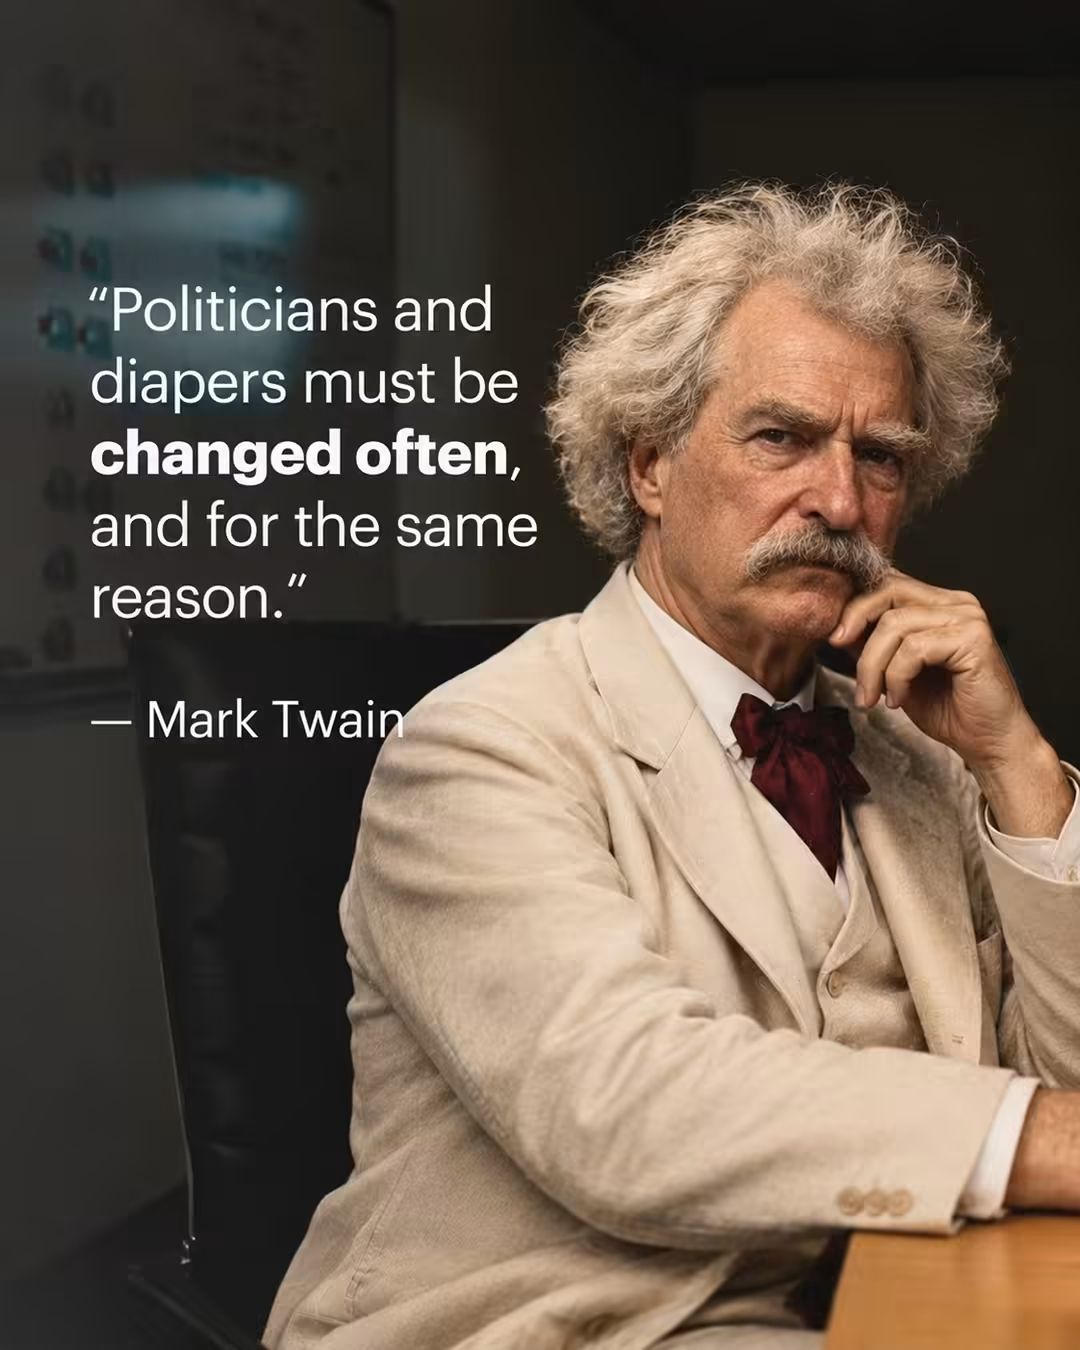
Quote of the Day on the Need for Change
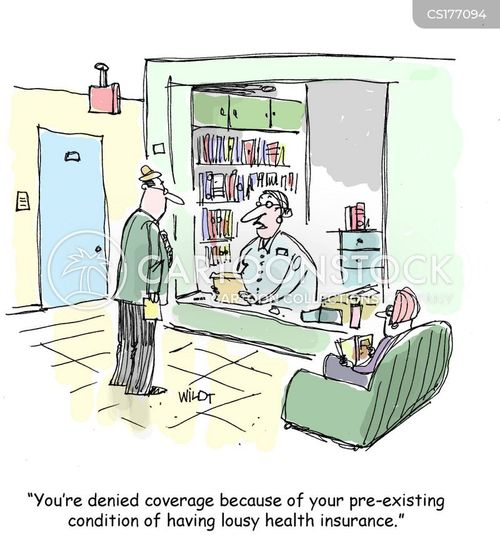
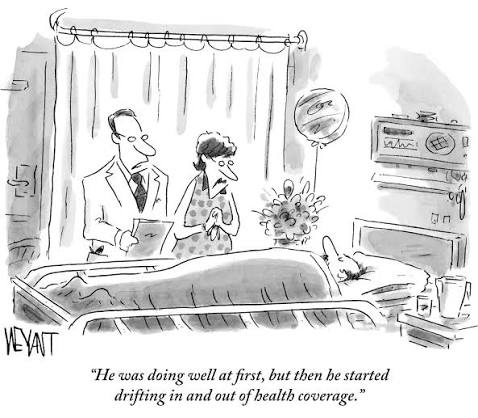
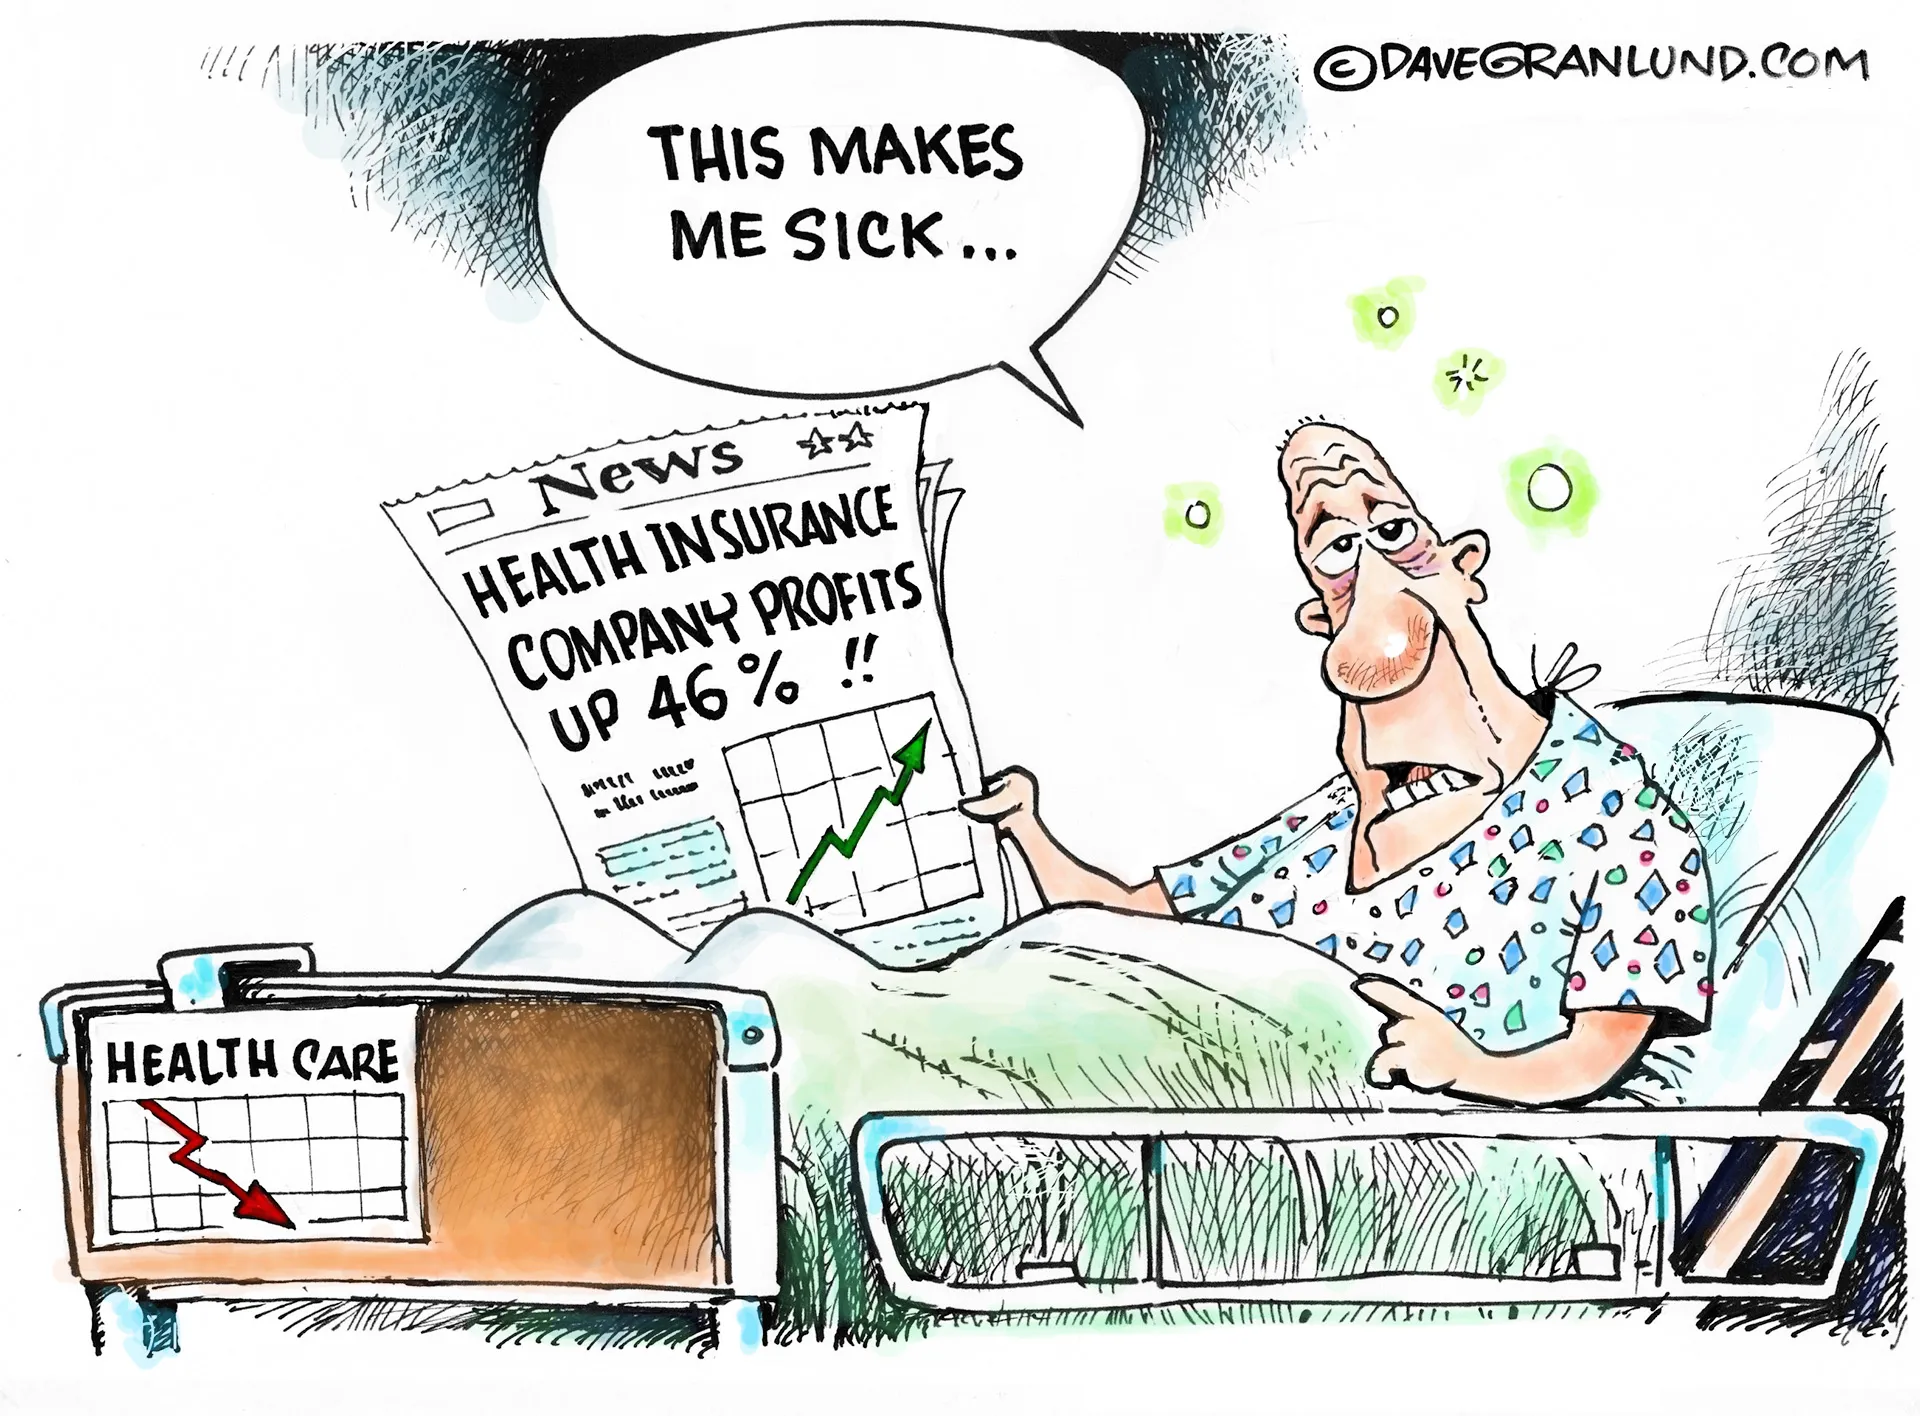

Last Friday, I had the honor of meeting with Fellows in the Milbank Memorial Fund program where top state health department and elected leaders discuss policy issues facing their states. Their issues are mounting and complicated. Their role and the scope of their responsibilities are expanding. Per the National Association of State Budget Officers, health programs accounted for 31% of the average state’s budget in FY2025 though what’s included and how it’s spent varies widely by state.
Most are compensated below their private sector peers. All work long days. All share similar challenges:
The federal government played a back seat to states until the modern era. That changed as Medicare and Medicaid became the primary banks for healthcare. By design, states oversaw the delivery and financing of healthcare services within their borders, often experimenting with innovations in coverage to address growing access issues in underserved populations.
Today, states have a full plate: control licensing and scope of practice, insurer solvency and coverage requirements, retail pharmacies, public health programs, competition, price transparency, facility adequacy and safety (hospitals, nursing homes et al) and many much more. Since the conservative leaning Supreme Court’s decision in Dobbs v. Jackson Women’s Health Organization (2022), tricky issues like abortion rights and others have defaulted to states to adjudicate further taxing the state’s healthcare leadership and resources.
The road ahead for state healthcare regulators will be harder regardless of the state’s population, partisan leaning and resources. Spending levels are not sustainable, dissatisfaction with the health system is at an all-time high and neither political party has advanced solutions that achieve the triple aim: better care, lower cost and universal access. Reality:
In 2009 in preparation for the White House Office of Health Reform Affordable Care Act deliberations with industry groups, I examined the structures, financing and clinical results of health systems in developed economies (OECD) of the world. Each was unique, but all operated at lower cost than the U.S. and all produced population-based clinical results that rivaled the U.S. Of the 12 I studied closest, the U.S, ranked in the bottom 3 on almost every measure except one: cost.
No two countries are alike like no two states are alike, but three structural elements were apparent in every system that outperformed the U.S.:
The conundrum for Milbank Fellows is the obvious: big, structural changes like these require federal involvement. They’re common sense. They’re not about bad people; they’re about structural flaws in the status quo that need fixing.
It will require a thoughtful, national plan to transform the U.S. system. States can be the stimulus for change, especially through interstate initiatives and knowledge-sharing akin to the Milbank Fellows Program.
Ultimately, it will require a federal Manhattan Project that subordinates the proprietary wishes of the industry special interests and political gamesmanship by partisans to achieve a system that’s sustainable, effective, efficient and operates with and for the people served.
States are the frontline for system reform in U.S. healthcare.

Last week was business as usual for the U.S. health system as other events grabbed the lion’s share of media attention:
With the exception of continued commentary about the Lindsay Clancy’s mistrial and post-partum psychosis defense, the healthcare system was virtually unscathed last week. For many in healthcare, ‘out of sight, out of mind’ is OK. It allows the system to operate without distraction from unwelcome criticism—disdain for media coverage has long been the preferred modus operandi in healthcare, preferring instead its own PR, ads and behind the scenes advocacy to keep things in order to its liking. It isn’t working.
Reality: The U.S. healthcare industry is not the crown jewel of our national pride. At the opening ceremony of the 2012 Olympic Games in London, the Danny Boyle-produced tribute to the National Health Service opened the games. A similar sentiment about the U.S. system is unimaginable. In its place, a dark cloud hovers above U.S. healthcare today. It is the industry’s biggest threat. The eminent cloud burst will wrack havoc on every provider, every investor, every user and every taxpayer in the U.S. unless preparedness is taken seriously.
It did not form overnight: it’s been building for 30 years but it darker and more threatening today than ever before. Here’s why:
Political campaigns obscure facts and oversimplify solutions to complex challenges like fixing the health system. Protecting the status quo in healthcare is what its insiders want and it’s why they’re on defense.
Paul
PS On 9/11/01, I was in Harry Jacobson’s conference room at Vanderbilt Medical Center discussing plans for our new Center for Integrative Health. The pictures of planes crashing into the World Trade Center, souls jumping to their deaths, fire-fighters running toward danger and dusty New Yorkers in zombi-like bewilderment are etched forever in my memory. It makes faith and family more meaningful and industry issues less. But in those days and after, our country seemed, if only for short while, united for a purpose. That spirit is needed for transformational change to the health system. It’s collapsing like the twin towers.

Last week, the American Hospital Association released a study by Kaufman Hall, its preferred data vendor, that took issue with methodologies used by critics of hospital consolidation:
“These findings suggest that a more comprehensive analysis of hospital M&A transactions, one that considers impacts on all patients served, broadens the focus to impacts beyond pricing, and considers the consequences if an M&A transaction is not permitted to proceed, would ensure not only competitive but also healthy hospital markets that can continue to provide the fullest possible range of services.”
The report discusses how hospital merger reviews should look beyond the potential impact on commercial insurance prices and consider what proposed transactions mean for all patients, particularly the nearly 60% of hospital patient days attributable to Medicare, Medicaid and Medicare Advantage beneficiaries whose payment rates are largely set by government programs.” Drawing on analyses of challenged and canceled transactions, the report also finds that hospitals seeking partners often serve more vulnerable communities and face greater financial pressures, and that when proposed deals do not move forward, struggling hospitals can experience significant financial deterioration that threatens services, workforce stability and access to care.”
Kaufman Hall added this disclaimer: “The findings contained in this document may contain predictions based on current data and historical trends. Any such predictions are subject to inherent risks and uncertainties. Past performance is not necessarily indicative of future results. Kaufman Hall accepts no responsibility for actual results or future events.
Also last week, a Health Affairs commentary “In 2026, States Are Leading On Health Care Affordability” noted that “Research has consistently shown that hospital prices are the largest driver of commercial health care spending growth. Hospital markets are dominated by monopolies, which enable hospitals to charge higher prices without improving quality or outcomes. State policymakers are increasingly looking for options to limit excessive hospital prices. Our research shows that capping the highest, most egregious prices charged by hospitals can meaningfully improve health care affordability while still allowing hospitals to generate a healthy margin…
A key driver of rising health care prices is consolidation in health care systems, including through hospital acquisitions of physician practices. These acquisitions, which are a form of vertical integration, increase hospital prices by 3 to 5%. This can be attributed to greater bargaining power, more intensive coding practices, and hospitals charging facility fees at what were previously independent physician practices but are now treated as “hospital outpatient departments.” To address these issues, states are increasingly considering facility fee bans or “site-neutral” policies that would cap prices for certain routine hospital outpatient services that could be provided safely in an office setting.”
Both positions are defensible.
Not for profit and public hospitals are at a disadvantage in managing their finances because they’re obligated to serve entire communities without regard to local economies or population health. Investor-owned hospitals and insurance companies have fewer restrictions and can exit markets at will.
And almost every hospital is dependent on reimbursement from commercially insured patients to offset what is the widely-accepted calculus that Medicare and Medicaid reimbursement doesn’t cover the total cost of care provided enrollees. Thus, across the hospital industry, the playbook has been straightforward: to optimize hospital finances….
This scheme has worked for 40 years to enable hospitals to control at least 50% of total health spending: 31% for traditional hospital services, 12% of total physician services, and ventures, partnerships, ancillary services and post-acute services in addition. In the aggregate, hospitals are the most important cog in the healthcare wheel. They’re labor intense, capital intense, complicated businesses that enjoy public trust that’s slipping away, especially among the 25 million who work in the industry. Complicating matters, distinctions between rural and government safety net hospitals and highly profitable investor-owned and not-for-profit systems are attracting unwanted scrutiny from regulators and in media coverage.
While Kaufman Hall raises legitimate questions about current methodologies used by state and federal regulators to assess consolidation, it does not answer the bigger question: what role should hospitals play in the U.S. system as AI-derived clinical innovation proliferates, labor and supply costs accelerate and fewer people can afford services?
It’s not clear.
And many others.
The American Hospital Association is right to be concerned about how regulators are addressing hospital consolidation and its impact on prices. And they’re right to challenge methodologies applied to questions about hospital prices and competition. But they fall short in offering a vision for the future of the health system that’s plausible, affordable and compelling. Rather, they offer a hospital-centric vision based on suspect assumptions and inadequate sensitivity to market trends not directly associated with traditional health services.
Every stakeholder in the health system—including hospitals and physicians—face heightened pressure to eliminate unnecessary utilization and costs due to willful or unknowing fraud. Just as insurer prior authorization practices have been frustrating to providers, unnecessary care is confounding to regulators and employers. The use of agentic AI tools to examine appropriateness of tests, procedures, medications and visits will exponentially change how “quality of care” is defined and regulated, and how its delivered. It’s a big deal everywhere, especially in Medicaid programs.

As lawmakers develop a national artificial intelligence framework, health insurers are already using automated decision-making tools to influence Americans’ access to care.
Barack Obama spent an hour last week telling House Minority Leader Hakeem Jeffries and a room of Democratic donors that artificial intelligence is “moving very fast in private hands” and that the party needs a real plan before it gets away from them entirely. He said a public framework on AI safety was urgently needed and that Democrats should make AI safety a “central agenda” in January when the next Congress is sworn in and when attention begins to shift to the 2028 elections.
Obama’s remarks were reported this past weekend alongside similar warnings and calls from AI industry leaders.
House Democrats apparently are working on the kind of “framework” Obama called for. Jeffries launched the House Democratic Commission on AI and the Innovation Economy last December, and the commission reportedly has a policy framework due this fall. That’s good news – and a good start. Rules governing how AI is built, tested and deployed will inevitably shape how health insurers can use it. But that framework also has to account for what happens when AI moves into high-stakes, industry-specific decisions. But if it doesn’t mention health insurance by name, it will have missed the industry that is already furthest along in using AI to make decisions about who lives, who dies, and who pays — with almost no oversight at all.
THE BOTTOM LINE: Health insurers are already using algorithms to influence coverage decisions. Any federal AI framework should require meaningful human review, clinician override authority, transparency and patient appeal rights.
This isn’t a hypothetical harm sitting somewhere out on the horizon, the way a lot of the AI safety conversation still is. It’s happening in claims systems right now. And the company doing it loudest and proudest is none other than the biggest and most profitable health insurance conglomerate, UnitedHealth.
UnitedHealth told shareholders and Wall Street financial analysts when it announced first quarter profits in April that it’s spending $1.5 billion on AI in 2026 alone, with executives promising a “conservative” 2-to-1 return within 12 to 18 months. A third of that money is going into new AI software products the company hopes to sell to other health systems. The other two-thirds is going into what Optum Insight’s CEO called “signature end-to-end processes” — the internal machinery of how the company handles care.
Some of that machinery is aimed at speeding up prior authorization decisions, and the company points to real numbers: turnaround times cut, call volumes down, a pharmacy tool that reportedly shrank prescription approval from eight hours to under 30 seconds. That’s good if true and the whole story. Nobody is nostalgic for eight-hour prior auth waits.
But the same earnings calls that tout faster prior auth decisions (denials as well as approvals) are the ones that tout a lower medical loss ratio — the industry’s term for the share of premium dollars that actually goes to patient care. UnitedHealth’s second-quarter medical care ratio fell 270 basis points this year, and executives credited the AI investment directly for that unexpectedly big decline in medical spending. When a company brags to Wall Street that artificial intelligence helped it spend less on medical care, that is not a customer-service story. It’s a story about how the company is boosting profit margins, and patients are the input being optimized.
UnitedHealth and Humana are both being sued right now over their use of an algorithm called nH Predict, which families allege was used to cut off coverage for elderly and disabled patients in extended care — sometimes overriding the judgment of the company’s own medical staff — based on a tool plaintiffs say gets it wrong up to 90% of the time on appeal. Cigna is fighting a parallel case over its PxDx system, which ProPublica found had denied more than 300,000 payment requests in a two-month span, with a company doctor spending an average of 1.2 seconds per claim.
Both cases, which are still working their way through the courts, rest on the same basic allegation: that a health plan let software stand in for the individualized medical review its own policies promised. A federal judge has already allowed the Cigna case to move forward on exactly that theory.
Elizabeth Nicholas, writing in Vanity Fair last week about her own fight with her insurer during breast cancer treatment, put the trajectory more starkly than I have. Her argument is that the industry has already trained the humans who run it to set their humanity aside and act like machines — which is exactly what will make humans so easy to replace. (Several big insurers, including Cigna where I used to work, have said they are laying off thousands of workers this year.) Soon, she writes, “there won’t even be executives left to email; only code,” carrying out profit directives with no capacity for hesitation or mercy. Her essay’s whole premise was that she still had a CEO’s name to put in an email she sent begging the insurer to reverse a denial of a life-saving treatment. Take the human off both ends of that exchange and there’s no one left to shame, sue, or vote out.
A handful of states aren’t waiting for Congress. Colorado now requires bias audits and guaranteed appeal rights for AI-driven coverage decisions. But even bias audits raise a bigger question of what exactly counts as bias when an insurer builds these tools? An algorithm can pass checks for discrimination and still be designed to advance the insurer’s financial interests, including reducing spending on medical care. And as insurers increasingly build their tools on general-purpose AI models, biases embedded in those underlying systems can carry into whatever gets built on top of them.
California and Texas have both moved to require that a licensed physician, not an algorithm alone, sign off on any denial based on medical necessity. That’s real progress — and it’s also proof of how far behind federal policy is. Coverage decisions shouldn’t depend on which state you happen to live in.
Jeffries has already put two members of his caucus in charge of a group that presumably will come up with recommendations on health care reform priorities. Alexandria Ocasio-Cortez of New York and Terri Sewell of Alabama are co-conveners of House Democrats’ Cost of Living Healthcare Working Group, tasked with building out the party’s affordability agenda on health care. So far, the public framing of that group has been about premiums, Medicaid cuts, and ACA tax credits. None of that is wrong. But if AI’s growing role in coverage denials isn’t part of what Ocasio-Cortez and Sewell put forward, the working group will have missed the fastest-moving cost driver in the field they were assigned to cover. They’re the two members with the standing and the mandate to put specific, concrete AI proposals on the table — not vague concern, but actual legislative language on human review requirements, transparency, and audit rights. That’s the natural home for this work, and it shouldn’t wait for the broader framework Jeffries is still finishing.
Every argument Obama made to Jeffries about why Democrats need an AI framework applies with more force, not less, to health insurance. He talked about job displacement from AI — insurers are already using it to displace human medical judgment. He talked about AI moving fast in private hands — seven for-profit companies control most of the American health insurance market, and they answer to shareholders, not patients. He said he didn’t want to be a “doomer,” and neither am I. AI genuinely could help identify fraud, speed up legitimate approvals, and cut the paperwork that eats a doctor’s week. Nobody serious is arguing it should be banned from health care.
The argument is narrower than that: When an algorithm is making or heavily influencing a decision about whether a person gets the care their doctor ordered, someone accountable has to be able to explain why, a licensed clinician has to be able to overrule it, and the patient has to have a real path to appeal. Right now, in most of the country, none of that is guaranteed.
Any Democratic AI framework that talks about jobs, misinformation, and existential safety risk while staying silent on the algorithms already deciding who gets a breast cancer treatment, a hip replacement or a nursing home stay isn’t a serious framework. It’s an incomplete one. Jeffries has the chance to make sure it isn’t — and given that he reportedly brought up the resignation letter of an Anthropic employee warning about the dangers of AI development in his conversation with Obama, he’s clearly already thinking about where AI could do real damage. Health insurance should be at the top of that list, not an afterthought to it.

